Building an offline web map
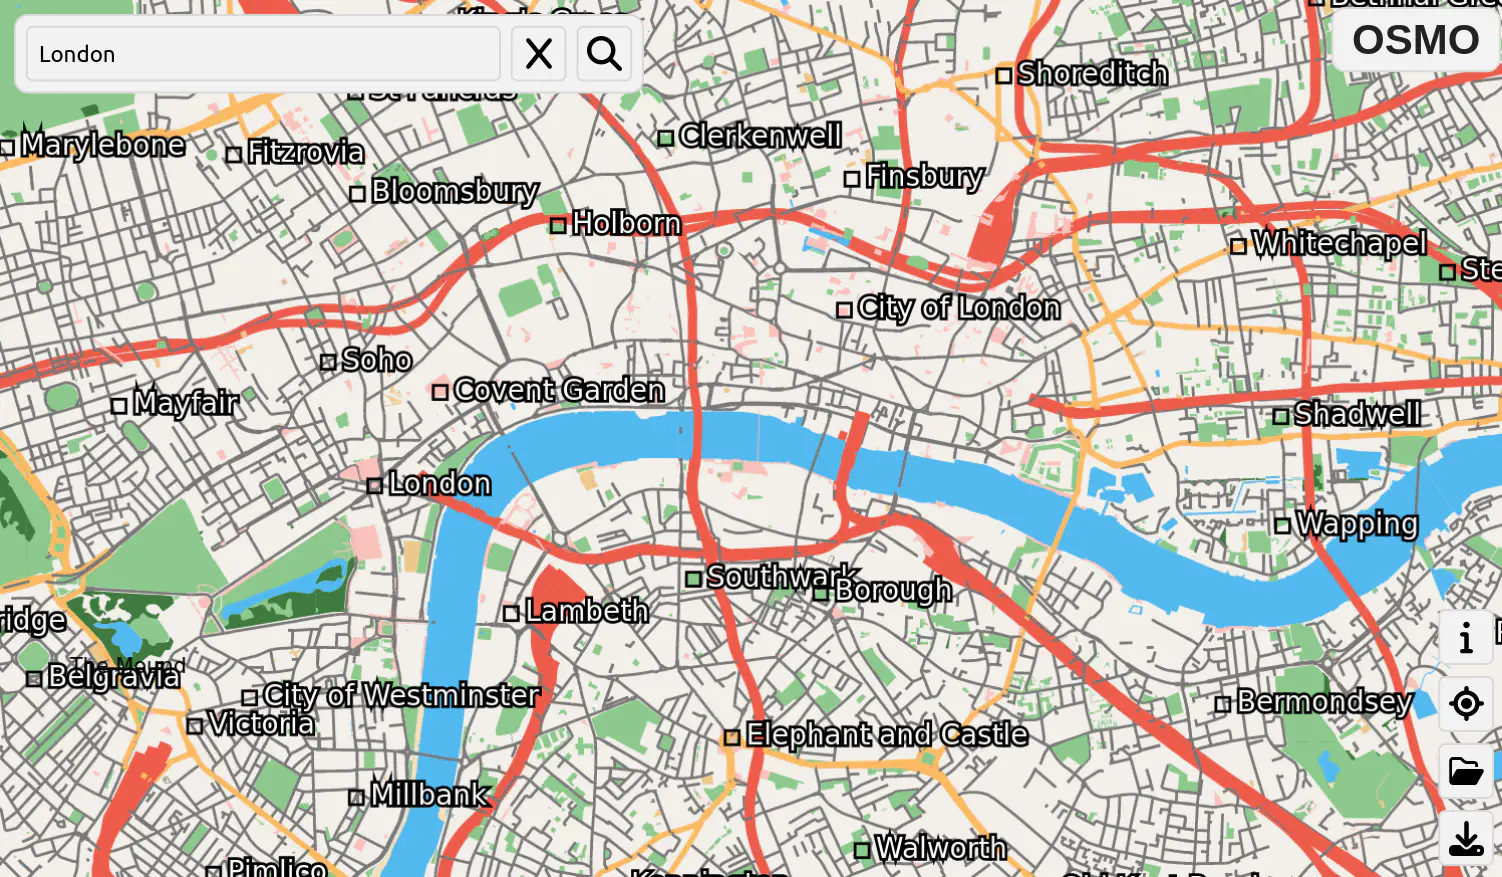
- This post is more than 6 months old. Circumstances or my opinions may have changed.This is a summary of the Final Year Project that I completed as part of my last year at Royal Holloway. The task was to produce an “Offline HTML5 Map Application”. You can try out the result, OSMO, at files.george.honeywood.org.uk/final-deliverable/. The code is available on GitHub, and I have also written a formal report.
Building an offline HTML5 map application is a slightly weird thing to do. Most web maps are decidedly online, fetching tiles dynamically from a tile sever whenever they are required. Most offline map applications are native apps for mobile devices, which fulfil the main use case for an offline map, navigation. However, it is possible to build offline web apps, through technologies like Service Workers, and it seemed like a good opportunity for me to understand the lower levels of how web maps work.
What follows is less of a summary of how a digital map is built, and more of a description of the things I found interesting along the way.
OpenStreetMap data#
First, you need data to render. Raw OpenStreetMap data comes in either XML, or a more efficient, but semantically similar binary representation, known as PBF. Neither of these are particularly suitable for rendering a map from – they are instead designed to simplify editing. Here is an example of a building in raw OSM XML:
<osm version="0.6" generator="CGImap 0.8.8 (2471524 spike-07.openstreetmap.org)" copyright="OpenStreetMap and contributors" attribution="http://www.openstreetmap.org/copyright" license="http://opendatacommons.org/licenses/odbl/1-0/">
 <way id="590592938" visible="true" version="4" changeset="122480423" timestamp="2022-06-16T20:22:59Z" user="GeorgeHoneywood" uid="10031443">
  <nd ref="5638445937"/>
  <nd ref="5638445938"/>
  <nd ref="5638445939"/>
  <nd ref="5638445940"/>
  <nd ref="5638445937"/>
  <tag k="addr:housenumber" v="21"/>
  <tag k="addr:street" v="Locksley Drive"/>
  <tag k="building" v="detached"/>
 </way>
 <node id="5638445937" lat="50.7929905" lon="-1.8975593" visible="true" version="3" changeset="85567769" timestamp="2020-05-21T17:50:39Z" user="GeorgeHoneywood" uid="10031443" />
 [... more nodes ...]
</osm>
Instead of the shape of this building being directly represented (like a GeoJSON LineString), a way is made up of constituent nodes, which can then be looked up by ID, to find their position, to derive the geometry of a building. Each of these ways is linearly stored in the file, one after the other, with no geospatial indexing.
Performance considerations#
In order to allow for real-time rendering of a map, we have to make two main optimizations: tiling, and zoom simplification. These are both processes that have to be done in advance.
Tiling is the process of splitting the map data into a grid of tiles. Dividing the area up into a grid means that we only need to send (and render) the data currently within the clients’ viewport. For example, if a user is zoomed in on Trafalgar Square in London, there is no point sending detailed map data for the whole of the UK, or even the whole of London, as it will not be on the screen. Each zoom level has its own set of tiles, and these can be accessed through Z/X/Y coordinates, where the maximum X/Y values double as Z increases by one.
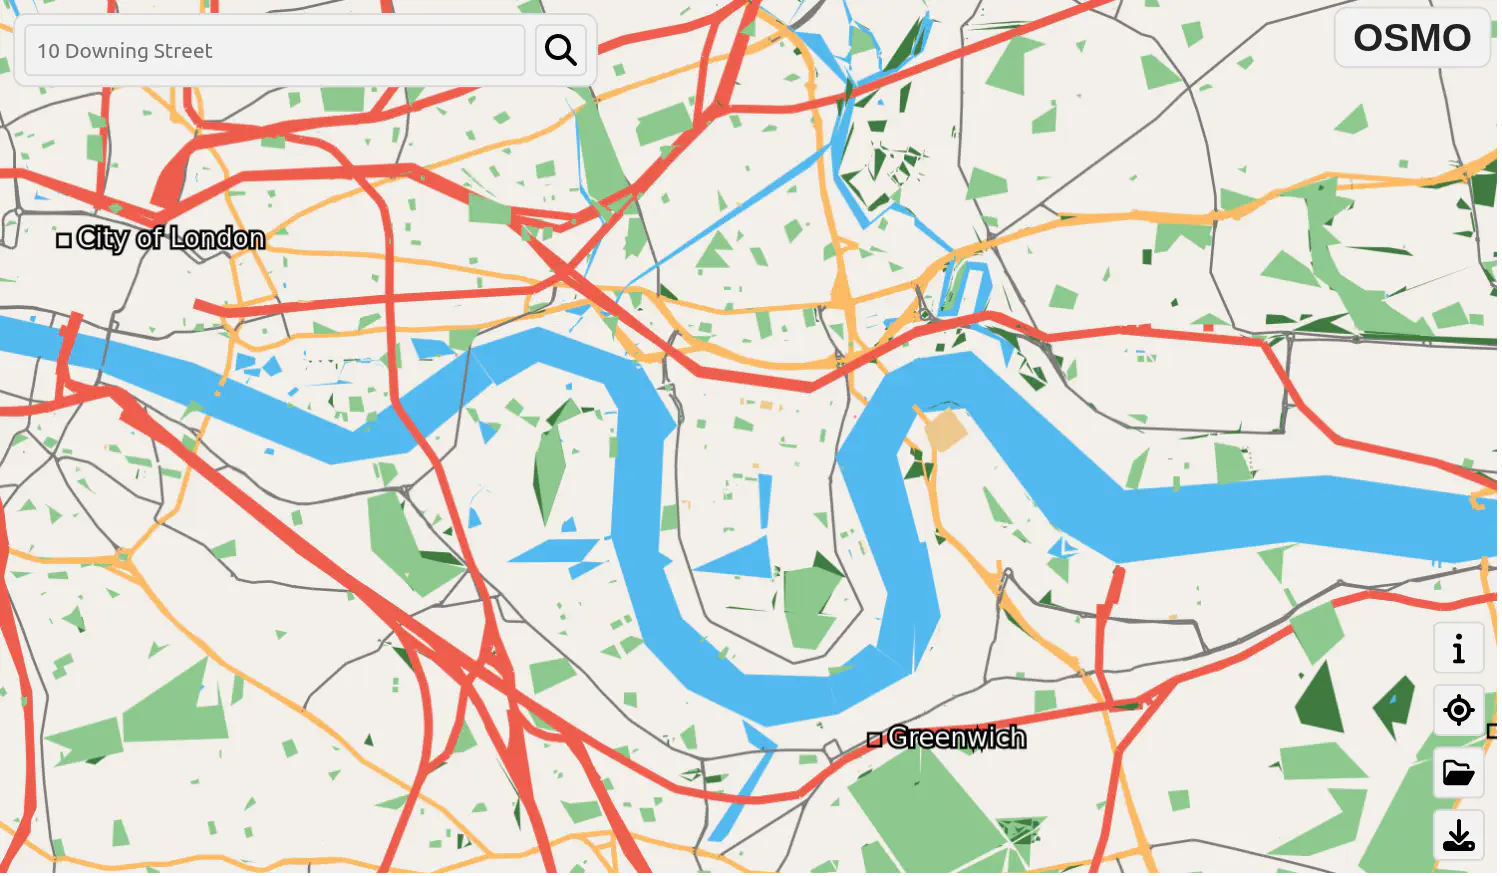
Simplification is less relevant for a zoomed in view, but is very necessary for a zoomed out region or country zoom level. It is simply not possible (in real time) to render all the detail of a whole country – and besides, rendering the exact geometry of a road is not necessary, as it can’t be seen from the zoomed out view. Therefore, in advance, we must simplify the data in order to remove unnecessary detail. This is effectively invisible to the user if executed well, as it should only remove what is imperceptible. The Douglas-Peucker algorithm is a popular algorithm for achieving this, but some manual tag-based checks are also required, so that you only preserve large roads and other important details when zoomed out.
As part of this, you need to decide at how many zoom levels you provide simplified versions of the geometry. There is a trade-off here – if you stored a simplified version for every zoom level between 1 and 20, the versions only one level apart will basically be duplicates, storing almost the same data, wasting space. For the zoom levels you don’t store a simplified version for, you can either “under-zoom” a more detailed one, or “over-zoom” in the other direction. For example, if you stored a simplified copy at zoom 14, you could still render data at z12, albeit at a performance loss, as you are rendering unperceivable details. Equally, you could also render at z16, but the artefacts introduced by simplification may become visible.
Mapsforge file format#
Developing my own map file format that handles both of these issues would have been a significant undertaking, so I decided that using an existing option would the best strategy. Luckily for me, the Mapsforge project has developed a file format which satisfies both of these requirements.
As far as I can tell, there is not an existing library for reading Mapsforge format map files in JavaScript/TypeScript, apart from this effort by ThomasHubelbauer – which goes as far as decoding the file header.
The basic structure of the Mapsforge file format is as follows (see the specification for details):
- Header: contains metadata about the map, such as bounding boxes, and details about the zoom levels that simplified geometry is stored for (hence referred to as “zoom intervals”).
- For each zoom interval, a subfile, which itself contains:
- An index, allowing you to locate simplified tile data via Z/X/Y tile coordinates.
- The simplified tile data itself, first Point of Interest (PoI) data, then Way data.
There are a number of neat tricks the format uses to eke out extra performance. For example, each zoom simplified tile is stored with a “zoom table”, which is used to limit the number of features that are rendered if a tile is being over-zoomed or under-zoomed. This seems a little odd, but as the data is stored in a priority order, Ways/PoIs that should be rendered at the lowest zooms are stored first, and therefore if we just stop rendering features after the depth specified in the zoom table, we can render extra features as we zoom, even though we are only storing a single simplified version of the tile. Therefore, roads will be stored before buildings, so when at a low zoom, we can simply stop after rendering the roads, avoiding rendering buildings.
Another more common trick the file format uses is delta (and double-delta) encoding. This is a useful technique for reducing the amount of space required to encode a sequence of numbers. The idea is that instead of storing a series of numbers like [50, 52, 48, 60], you instead store a start point, such as 50, and then also the difference between each number and the previous one, such as [2, -4, 12]. This approach is valuable for the map use case, as the majority of points will near the previous one, hence giving us delta values that are much smaller in magnitude than raw coords. Double-delta encoding takes this a step further, storing the difference between the deltas — the Mapsforge file writer opportunistically uses this approach when it results in a smaller file size.
In a similar vein to storing way coordinates with delta encoding, all coordinates in a tile are stored relative to the origin of the tile. This once again cuts down the magnitude of the numbers you are storing. Another nice technique is the encoding of coordinate values. Although you might assume that a coordinate, such as (54.6195, -3.0778), would be stored as two floating point numbers, they instead store coordinates as integer values in microdegrees — i.e. degrees × 10^6. This saves some space compared to storing floats, without compromising precision.
They also use a variable-length encoding scheme for integers, allowing both large and small numbers to be stored in the same format, without losing too much efficiency. For example, the naïve approach would be to use 32-bit integers for all numbers, but this would result in space being wasted when storing small delta values (which could fit in an 8-bit int). Therefore, they sacrifice the first bit of each byte as a continuation indicator, and use the remaining 7 bits to store (a part of) the actual value.
// decode a variable length _unsigned_ integer as a number
// this.data is a DataView, and this.offset is the offset we are reading from, in bytes
getVUint() {
    // if the first bit is 1, need to read the next byte. the rest of the 7 bits
    // are the numeric value, starting with the least significant
    let value = 0;
    let shift = 0;

    // check if we need to continue
    while ((this.data.getUint8(this.offset) & 0b1000_0000) != 0) {
        // if this not the first byte we've read, each bit is worth more
        value |= (this.data.getUint8(this.offset) & 0b0111_1111) << shift
        this.offset++
        shift += 7
    }

    // read the seven bits from the last byte
    value |= (this.data.getUint8(this.offset) << shift)
    this.offset++
    return value
}
The final trick that I’ve already partially discussed is packing multiple values into a single byte. This allows you to store up to 8 flags in 1 byte, instead of a whole byte for each flag. As the minimum you can read from a DataView is 1 byte, you have to do some bit manipulation to read out the individual boolean flags. This is a bit fiddly, but the space savings add up. Representing the bitmask values in binary with 0b makes it a bit easier to understand what is going on.
const flags = tile_data.getUint8()

const has_name =         (flags & 0b1000_0000) !== 0
const has_house_number = (flags & 0b0100_0000) !== 0
const has_elevation =    (flags & 0b0010_0000) !== 0
As I’d never written any binary parsing code before, this was quite an instructive process for me. Although the specification was very helpful, it was often not exactly obvious how to utilize the decoded data, and there were some confused details. At one point I had to dig into the Java sources of the reference implementation, as the specification did not align with what was actually in the files 1. I ended up writing a simple hexdump function to help me debug issues with my parser.
Rendering#
The next step is actually rendering the data. At a basic level this isn’t too complicated. You first need to project the coordinates from WGS-84 to your desired projection, in my case Web Mercator. The Web Mercator projection is conformal, meaning it preserves angles (locally) whilst distorting area. Once you’ve projected the coordinates, you can draw the data to the canvas. Firstly, to handle translation of the map, you will need x/y offset values, that which will alter what falls within the map viewport.
In order to handle map zooming, you need to implement a scale factor that you multiply the coordinates values by before drawing them, having the effect of stretching the map out 2. The complication here is that this will scale about the origin, so you need to will need to dynamically adjust the x/y offsets so that you zoom centred around the mouse position. Although this sounds simple enough, it was one of the things that took the longest to get right, as the maths was fiddly. This is the sort of code that you write, and then have no idea how it works the next day, and I am not proud.
// x and y are the mouse coordinates, and zoom_delta is the amount to zoom by
const new_zoom = this.zoom_level + zoom_delta;
let scale = 2 ** this.zoom_level;

const x_offset_scaled = (x - this.x_offset) / scale;
const y_offset_scaled = ((this.canvas.height - y) - this.y_offset) / scale;

scale *= (2 ** zoom_delta);

this.x_offset = x - (x_offset_scaled * scale);
this.y_offset = (this.canvas.height - y) - (y_offset_scaled * scale);

this.zoom_level = new_zoom
Range requests and service worker abuse#
My next goal was to make the app work offline. Naïvely, this is simple — just store the whole map file in a Service Worker cache, then fetch() it from there when offline. This approach worked fine while I was initially testing the app, given I was only using small map files (say >10 MB). Unfortunately, country sized maps will be much larger — the map file for England is about 1 GB. While it is actually possible to fetch() and store a 1 GB blob in a Service Worker in modern browsers, having to download the entire map file on launch is terrible UX. I had two design goals in conflict:
- The app should work instantly online, without a lengthy download period
- The app should work offline
When online, we could do with some way of only partially loading the file, loading more data as the user pans the map. This is where range requests become useful, allowing you to fetch certain byte range(s) from a file 3. The Mapsforge file format was not designed with this use case in mind, but it is actually fairly efficient. To be able to read a map tile from its Z/X/Y coordinate, we first need to look up its byte position in the file, using the indexes. As this is a common operation, and we have significant network latency, it makes sense to cache the indexes at startup, as they are actually fairly small. For example in the England map file, in the most detailed sub-file (at zoom 14), there are about 200,000 tiles, and each index entry is 5 bytes. This means that in total the largest index is about 200,000 × 5 = 1 MB.
Unfortunately, this has broken offline support, as we can we no longer have the whole file available to stash in the Service Worker. While Service Workers can serve HTTP range requests from a larger cached file (useful for storing video offline), there is no mechanism to store only portions of a larger file. This is where I went slightly off-piste. The general idea of Service Workers is that they are a proxy between the browser and the network, meaning you can intercept and decide how requests are replied to. Normally they are quite boilerplate, or use abstractions like Google’s Workbox — however you are completely free to implement your own custom logic.
Therefore, I implemented a scheme that allowed byte ranges to be stored, by inserting them into the Service Worker cache as separate request/response pairs. When a request was intercepted by a service worker, it would first check if it already had the byte-range, then if not, fetch it and cache it. The beauty of this approach is that it is completely transparent to the rest of the app, which just acts as if it is fetching ranges from the network. The ugliness of it is that the Service Worker cache is designed to store pairs of Request and Response objects. You retrieve the Response objects by passing the URL you want into cache.match(). But as we are dealing with byte ranges of a single file, we only have a single URL! To make multiple URLs I ended up appending a ?bytes=${start}-${end} query string to each range stored in the cache, which is quite an offensive hack.
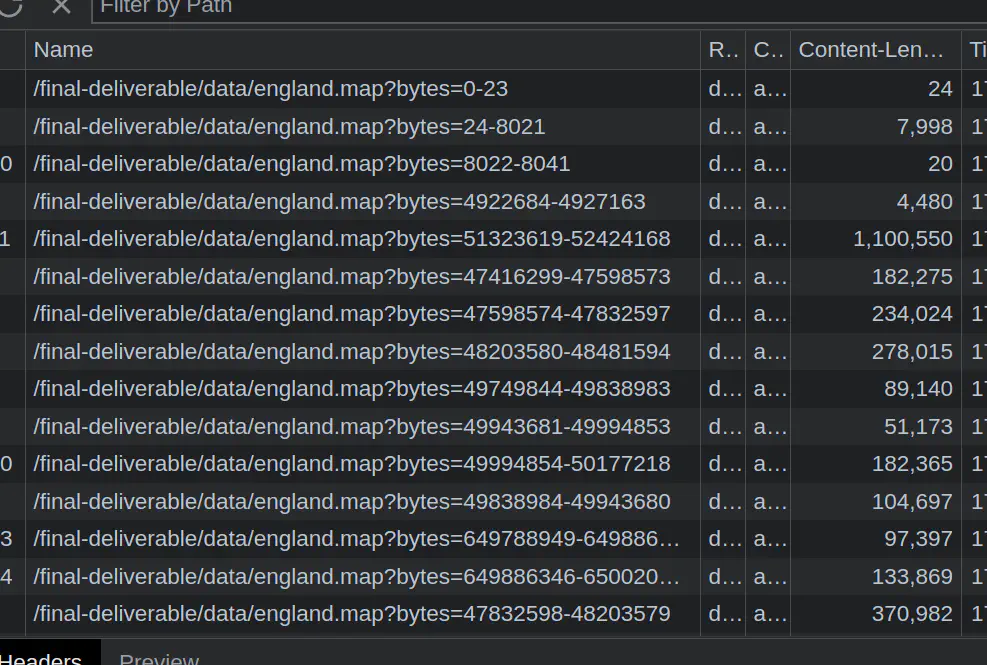
?bytes query string variableThis gave me the cache as you pan part of the solution, but I still wanted the user to be able to download a larger area for offline use, without downloading the whole 1 GB map. The simple approach to this is just fetching the byte ranges for each tile required, but if you are downloading a region this can quickly add up into thousands of tiles. You don’t want to be making that many HTTP requests all at once. Luckily tiles next to each other in the X dimension are stored in contiguous bytes, meaning you instead only have to make a single request for each row of tiles, effectively square-rooting the total (assuming your screen is square).
I ended up contributing a PR to clarify the wording of the specification. ↩︎
This scale factor actually needs increase exponentially, otherwise the zooming will get slower and slower as you zoom in. ↩︎
I was inspired to take this approach by the Protomaps project, who built a custom map format specifically for use with range requests. ↩︎
Page last updated by eecafd1 - 2025-08-24:
chore: drop comments:
Comments:
Send me a comment by emailing comments@george.honeywood.org.uk, with the subject line "map-from-the-ground-up".